 In spite of important advances in the description of the micellization process, no compact and practical model for the concentrations of monomeric and micellized surfactants in a solution of a given total surfactant concentration has been proposed so far. Such a model is essential for a quantitative analysis of experimental data from micellar systems.
We propose a model function for the monomeric and micellized surfactant concentration as function of the total surfactant concentration.
This concentration model provides an objective definition of the critical micelle concentration (cmc) and yields precise and well defined values of the cmc and of derived physical parameters.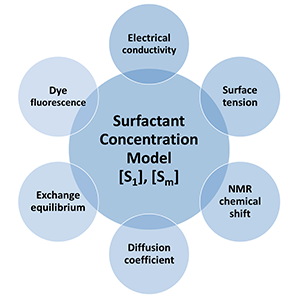
Fitting functions for specific properties of a surfactant solution can then be defined as a function of the monomeric and micellized surfactant concentration given by this concentration model.
The fit of this concentration model to experimental data substitutes subjective graphical procedures, reduces methodological differences, and thus allows one to compare directly the results of different techniques or to perform global fits.
We used the concentration model for the analysis of specific properties such as electrical conductivity, surface tension, NMR chemical shifts, absorption, self-diffusion coefficients, fluorescence intensity and mean translational diffusion coefficient of fluorescent dyes in surfactant solutions. Also the fluorescence emission of pyrene in micellar solutions (fluorescence intensity, band ratio, excimer formation and fluorescence lifetimes) are studied in detail.
See this page for examples of the curve fitting with the concentration model.
Model for the concentration of monomeric surfactant [S1]
|
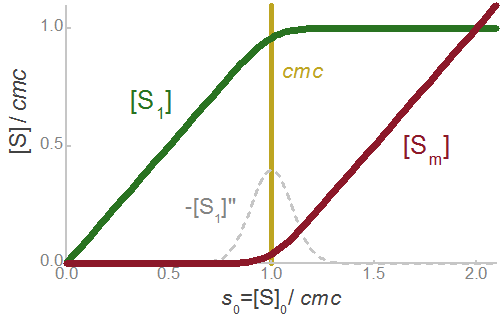
Concentration of monomeric surfactant [S1] :
Concentration of micellized surfactant [Sm] :
Concentration of micelles [M]:
Parameter:
|
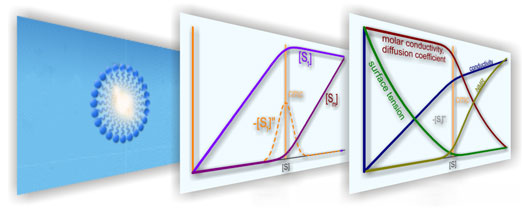
Concentrations of monomeric [S1] and micellized [Sm] surfactant |
See also the interactive graphic:
Application to direct properties of surfactant solutions. Determination of the critical micelle concentration cmc.
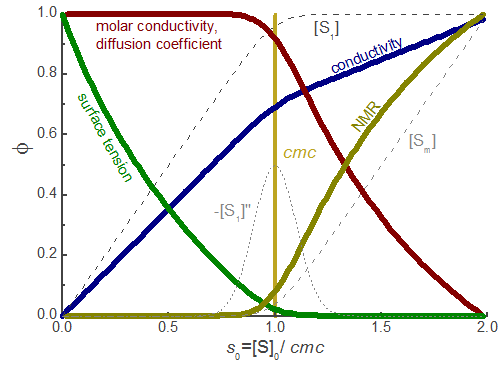 The concentration model for [S1] and [Sm] (eqs. (1) and (2)) can be used to describe a variety of properties of surfactant solutions. The derived models are very useful tools for a consistent analysis of experimental data obtained from surfactant solutions with different techniques. The fit of theses models to the full data set also within the curved cmc region (transition region) yields reproducable and objective values for the cmc and the derived parameters. The model can be fitted with standard nonlinear fit procedures both to single datasets and also globally to series of datasets with shared parameters. We strongly recommend this fit of an objective model over the widely used graphical method based on the intersection of straight lines. The graphical method is very subjective and does not allow to compare cmc values determined with different techniques.
We have applied the concentration model (eqs. (1) and (2)) succesfully to experimental data of the following direct properties of surfactant solutions:
- Electrical conductivity
- Surface tension
- NMR chemical shift
- Self-diffusion coefficient
Example: Electrical conductivity of SDS in water
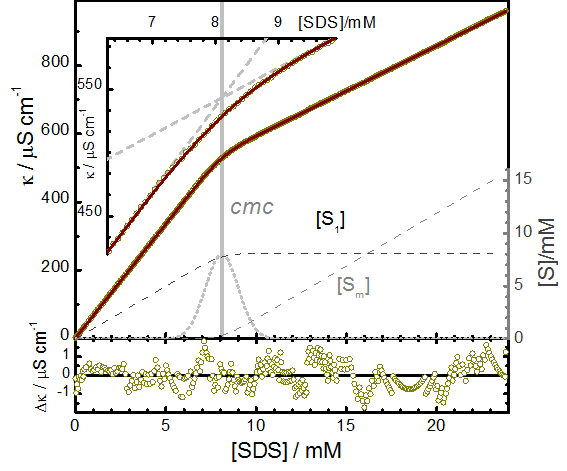 The conductivity of a solution of ionic surfactants of concentration [S]0 is given by
(4)
From the conductivity of the anionic surfactant SDS in water at 25ºC the cmc = 8.099 mM is determined with high precision. The relative transition width of about 10% (r = 0.112) corresponds to a transition region of σ = 0.9 mM.
a=66.74±0.03 S cm2mol-1 and b=26.43±0.01 S cm2mol-1.
► A Model for Monomer and Micellar Concentrations in Surfactant Solutions. Application to Conductivity, NMR, Diffusion and Surface Tension data
Wajih Al-Soufi, Lucas Piñeiro, Mercedes Novo, Journal of Colloid and Interface Science 2012, 370, 102–110 DOI: 10.1016/j.jcis.2011.12.037
Application to properties of solutes in surfactant solutions
The concentration model for [S1] and [Sm] (eqs. (1) and (2)) can also be applied to properties of solutes (solubilizates) in surfactant solutions.
Fluorescence intensity and mean translational diffusion coefficients of dyes in exchange (partition) equilibrium with micelles
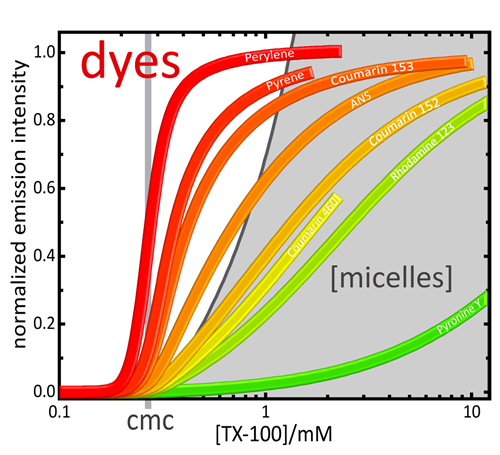
The absorption and fluorescence intensity of dyes in micellar solutions are often used for the determination of the cmc. However, dyes show an exchange (partition) equilibrium between the aqueous and the micellar phases with some partition equilibrium constant K, which is usually not taken into account. This is problematic, even for dyes with high affinity to micelles (high values of K) such as Pyrene, 2-anilinonaphthalene-6-sulfonic acid (ANS) or different Coumarins. Again, as in the case of the direct properties discussed above, the graphical determination of the cmc from straight lines does in general not give correct and reproducable results. The partition equilibrium constants K of the mentioned typical dyes are high but not infinite. Thus, for the correct determination of the cmc the partition of the dye has to be taken into account. This is achieved by the use of the concentration model (eqs. (1) and (2)) and the corresponding equations for the dye absorption of fluorescence intensity.
► Dye exchange in micellar solutions. Quantitative analysis of bulk and single molecule fluorescence titrations
Lucas Piñeiro, Sonia Freire, Jorge Bordello, Mercedes Novo, and Wajih Al-Soufi, Soft Matter 2013, 9, 10779-10790, DOI: 10.1039/ c3sm52092g
Fluorescence intensity, lifetime and excimer formation of pyrene in micellar solutions
The combination of the surfactant concentration model of eq. (1) with a systematic description of the complex photophysical behavior of pyrene in surfactant solutions allows us to reproduce with high accuracy the steady-state and the time resolved fluorescence intensity of pyrene in surfactant solutions near the cmc, both in the monomer and in the excimer emission bands.
We present concise model equations that can be used for the analysis of the pyrene fluorescence intensity in order to estimate fundamental parameters of the pyrene-surfactant system, such as the binding equilibrium constant K of pyrene to a given surfactant micelle, the rate constant of excimer formation in micelles, and the equilibrium constant of pyrene-surfactant quenching.
The values of the binding equilibrium constant KTX100 = 3300 103 M-1 and KSDS = 190 103 M-1 for Triton X-100 (TX100) and SDS micelles, respectively, show that the partition of pyrene between bulk water and micelles cannot be ignored, even at relatively high surfactant concentrations above the cmc. We apply the model to the determination of the cmc from the pyrene fluorescence intensity, especially from the intensity ratio at two vibronic bands in the monomer emission or from the ratio of excimer to monomer emission intensity. We relate the finite width of the transition region below and above the cmc with the observed changes in the pyrene fluorescence in this region
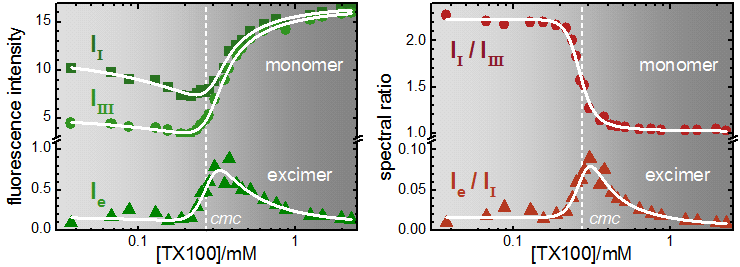
Fluorescence emission of pyrene in aqueous solutions of Triton X-100, [TX100] = 0.03 mM – 2.3 mM. Left Panel: fluorescence intensity in the monomer band, at peak I (371.9 nm, squares) and peak III (384.2 nm, circles) and in the excimer band at 500.0 nm, (triangles) as function of the TX100 concentration. Right Panel: spectral ratios (SRm=II/IIII) (circles) and SRe=Ie/II (triangles). Thick curves are Global fits of the model equations to the data. The dashed white vertical line indicates the cmc. ([Pyrene]=5.2 10-7 M, λexc=319 nm). Note the logarithmic concentration scale and the breaks in the intensity scales.
► Fluorescence Emission of Pyrene in Surfactant Solutions
Lucas Piñeiro, Mercedes Novo, and Wajih Al-Soufi, Advances in Colloid and Interface Science 2015, 215, 1–12. DOI:10.1016/j.cis.2014.10.010
Curve fitting with the concentration model (Determination of the cmc)
See this page for examples of the curve fitting with Origin, Excel and Python
Interactive graphics
A Model for Monomer and Micellar Concentrations in Surfactant Solutions from the Wolfram Demonstrations Project.
Please cite:
A Model for Monomer and Micellar Concentrations in Surfactant Solutions. Application to Conductivity, NMR, Diffusion and Surface Tension data
Wajih Al-Soufi, Lucas Piñeiro, Mercedes Novo, Journal of Colloid and Interface Science 2012, 370, 102–110 DOI: 10.1016/j.jcis.2011.12.037
Dye exchange in micellar solutions. Quantitative analysis of bulk and single molecule fluorescence titrations
Lucas Piñeiro, Sonia Freire, Jorge Bordello, Mercedes Novo, and Wajih Al-Soufi, Soft Matter 2013, 9, 10779-10790, DOI: 10.1039/ c3sm52092g
Fluorescence Emission of Pyrene in Surfactant Solutions
Lucas Piñeiro, Mercedes Novo, and Wajih Al-Soufi, Advances in Colloid and Interface Science 2015, 215, 1–12. DOI:10.1016/j.cis.2014.10.010
A Surfactant Concentration Model for the Systematic Determination of the Critical Micellar Concentration and the Transition Width (Review)
Wajih Al-Soufi and Mercedes Novo, Molecules 2021, 26, no. 17: 5339. https://doi.org/10.3390/molecules26175339
Comments or questions
Please visit our blog for comments or questions or send us an email. 