
FCS analyses spontaneous fluorescence intensity fluctuations provoked by molecular processes of systems at thermodynamic equilibrium.
The fluorescence intensity fluctuations can be due to
- chemical reactions
- association/dissociation
- structural changes
- or any other process which modulates the fluorescence signal
FCS derives physical or chemical parameters such as
- translational and rotational diffusion coefficients
- molecular weights
- flow rates
- kinetic rate constants of chemical reactions
- rate constants of association/dissociation
- triplet state lifetimes
- ...
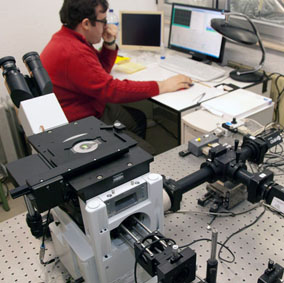
Confocal Setup
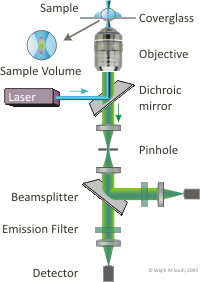

In FCS the molecules under study diffuse freely through the focus of a confocal epi-fluorescence microscope. The focus defines a very small effective sample volume of some femto-liter (10-15 liter). If the concentration of molecules is small (nano-molar, 10-9 mol/liter) then only very few molecules are observed at a time.
The molecules are excited by a laser through the microscope objective and their fluorescence is collected by the same objective and focused through a pinhole and filters onto detectors with single photon sensitivity.
The intensity of the fluorescence which reaches the detectors depends on the number of molecules present in the focus at each moment.
Intensity Fluctuations due to Diffusion
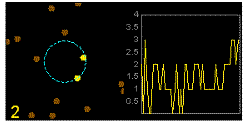
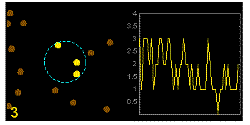
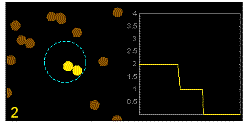
In the graphics the blue circle indicates the border of the sample volume. The small dots are dye molecules moving randomly through the solution (brownian motion). When they enter the sample volume they are excited and emit fluorescence light. On the right the total registered light intensity is indicated versus time. It is proportional to the number of molecules (N) emitting light at a time. With only a few molecules in the sample volume strong fluctuations of the light intensity is observed, which is due to the entrance or exit of single molecules into the focus: every molecule counts. The lower the number of molecules, the higher the amplitude of the fluctuation.
The characteristic time of the fluctuation in the light intensity depends on the average time the molecules stay in the sample volume. Small molecules diffuse fast, stay only a short time in the focus and provoke thus fast fluctuations (upper graphics). On the contrary, big and heavy molecules (or aggregates) are slow, stay a longer time in the sample volume and induce only slow changes in the light intensity.
The characteristic time of the intensity fluctuations reveals diffusional properties of the fluorescent particles.
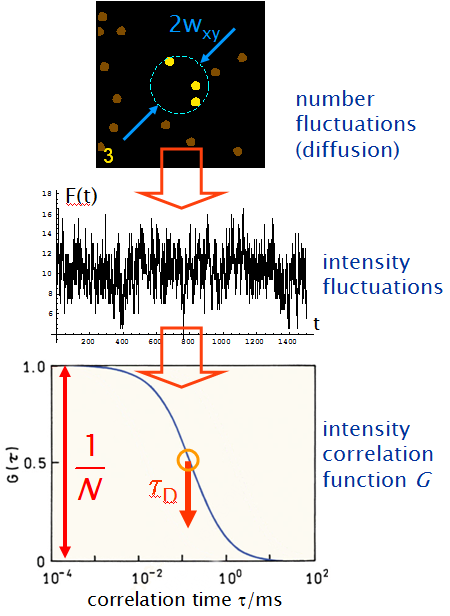
Summarizing, the process is the following:
- molecular diffusion provokes fluctuations in the number of fluorescent molecules in the sample volume
- the number fluctuations induce characteristic fluctuations in the observed fluorescence intensity
- the autocorrelation function of the intensity fluctuations reveals microscopic properties:
-> the amplitude gives the mean number of dye molecules N in the sample volume
-> the drop of the correlation gives the mean diffusion time (transit time) of the molecules through the sample volume.
With the calibrated dimension of the sample volume the diffusion coefficient of the molecules can be calculated
Fast Dynamics
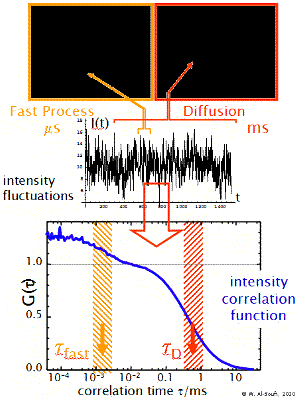
The transit of the dye molecule through the sample volume takes typically 100 us for small dye molecules and 1-10 ms for big particles, such as micelles or liposomes. During this transit the dye may suffer different fast dynamic processes which modulate the emitted fluorescence intensity in a characteristic way (blinking, flickering). These may be processes such as the transition to dark triplet states, reversible reactions or dynamic association-dissociation to a host molecule. These processes introduce additional shoulders (terms) in the correlation function at short timescales. Their analysis allows one to determine the relaxation rate constant of the processes.